ggplot2 now has an official extension mechanism. This means that others can now easily create their own stats, geoms and positions, and provide them in other packages. This should allow the ggplot2 community to flourish, even as less development work happens in ggplot2 itself. This page showcases these extensions.
ggiraph
Make ggplot interactive
ggstance
Horizontal versions of ggplot2 geoms
ggalt
Extra coordinate systems, geoms & stats
ggforce
Accelarating ggplot2
ggrepel
Repel overlapping text labels
ggraph
Plot graph-like data structures
ggpmisc
Miscellaneous extensions to ggplot2
geomnet
Network visualizations in ggplot2
ggExtra
Marginal density plots or histograms
gganimate
Create easy animations with ggplot2
plotROC
Interactive ROC plots
ggthemes
ggplot themes and scales
ggspectra
Extensions for radiation spectra
ggnetwork
Geoms to plot networks with ggplot2
ggtech
ggplot2 tech themes, scales, and geoms
ggradar
radar charts with ggplot2
ggTimeSeries
Time series visualisations
ggtree
A phylogenetic tree viewer
ggseas
Seasonal adjustment on the fly
ggthemes
https://github.com/jrnold/ggthemes
Some extra geoms, scales, and themes for ggplot
# Example from https://github.com/jrnold/ggthemes
library(ggplot2)
library(ggthemes)

p2 <- ggplot(mtcars, aes(x = wt, y = mpg, colour = factor(gear))) +
  geom_point() +
  ggtitle("Cars")

# Economist theme
# A theme that approximates the style of plots in The Economist magazine.
p2 + theme_economist() + scale_colour_economist() 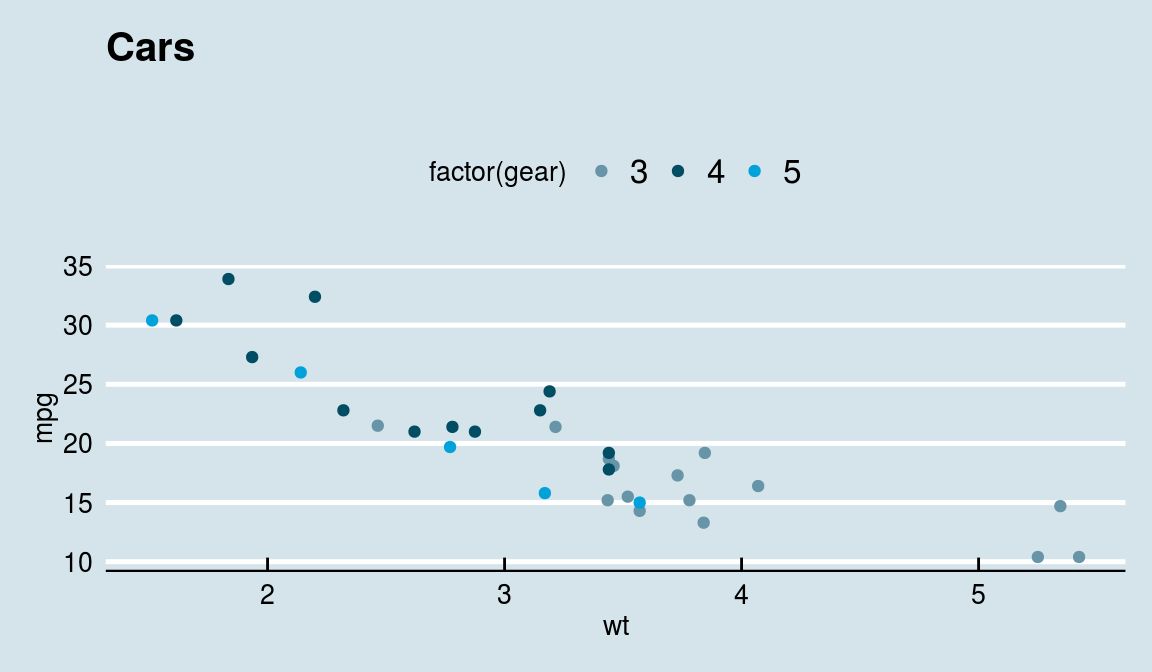
# Stata theme
# Themes and scales based on the graph schemes in Stata.
p2 + theme_stata() + scale_colour_stata()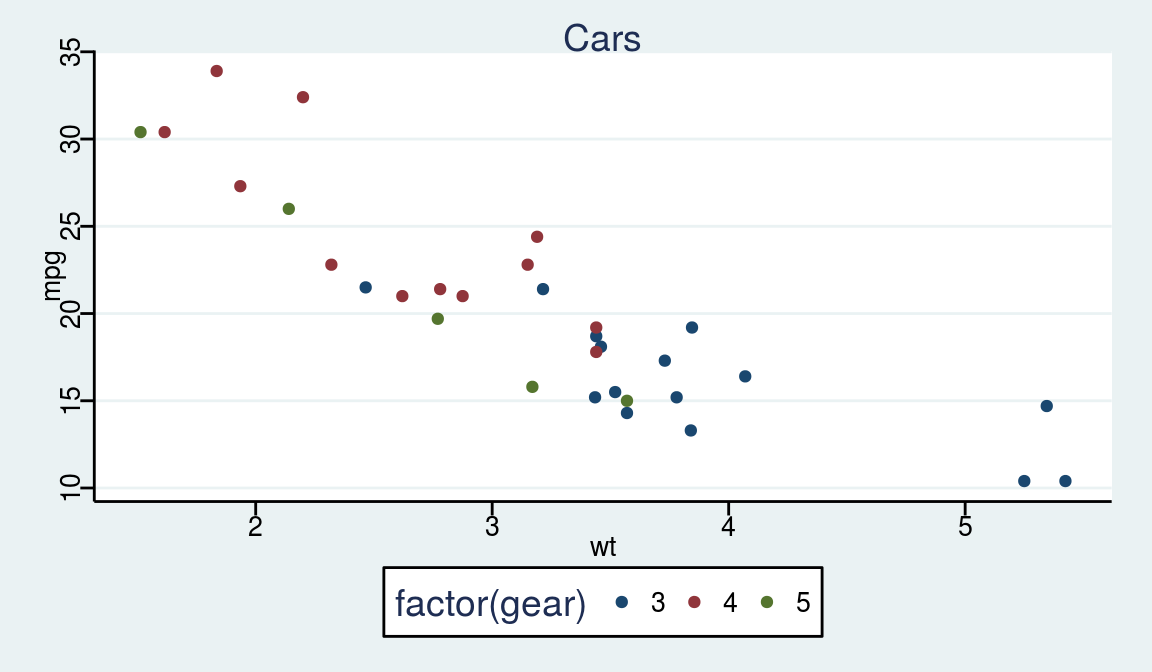
# Fivethirtyeight theme
# Theme and color palette based on the plots at fivethirtyeight.com.
p2 + geom_smooth(method = "lm", se = FALSE) +
  scale_color_fivethirtyeight("cyl") +
  theme_fivethirtyeight()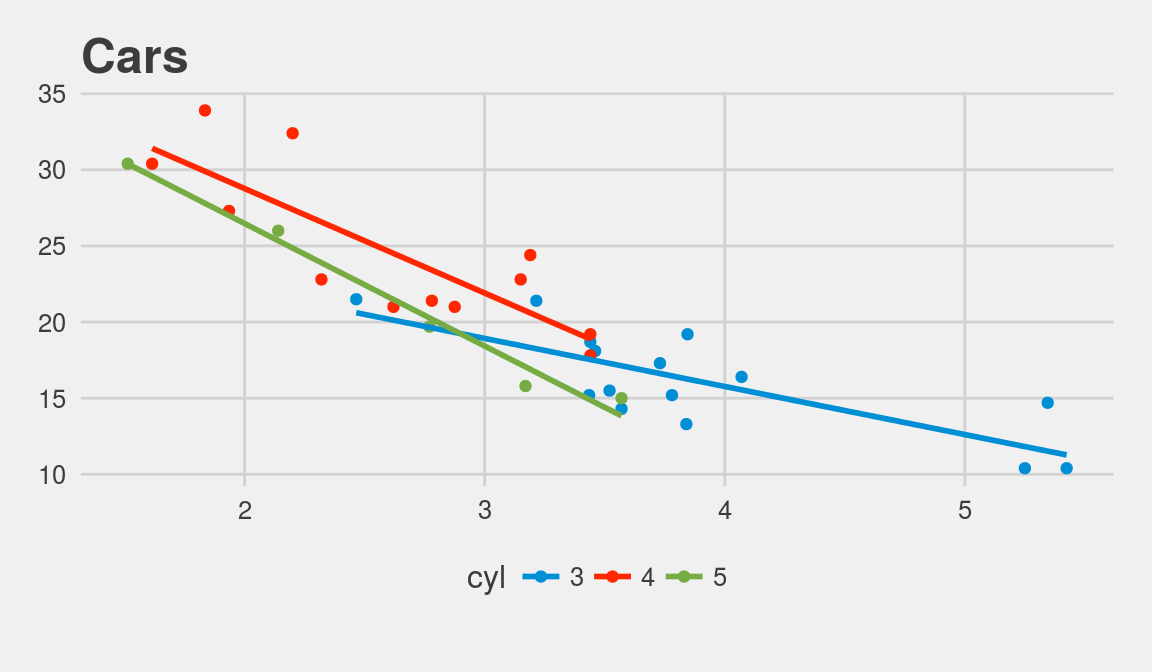
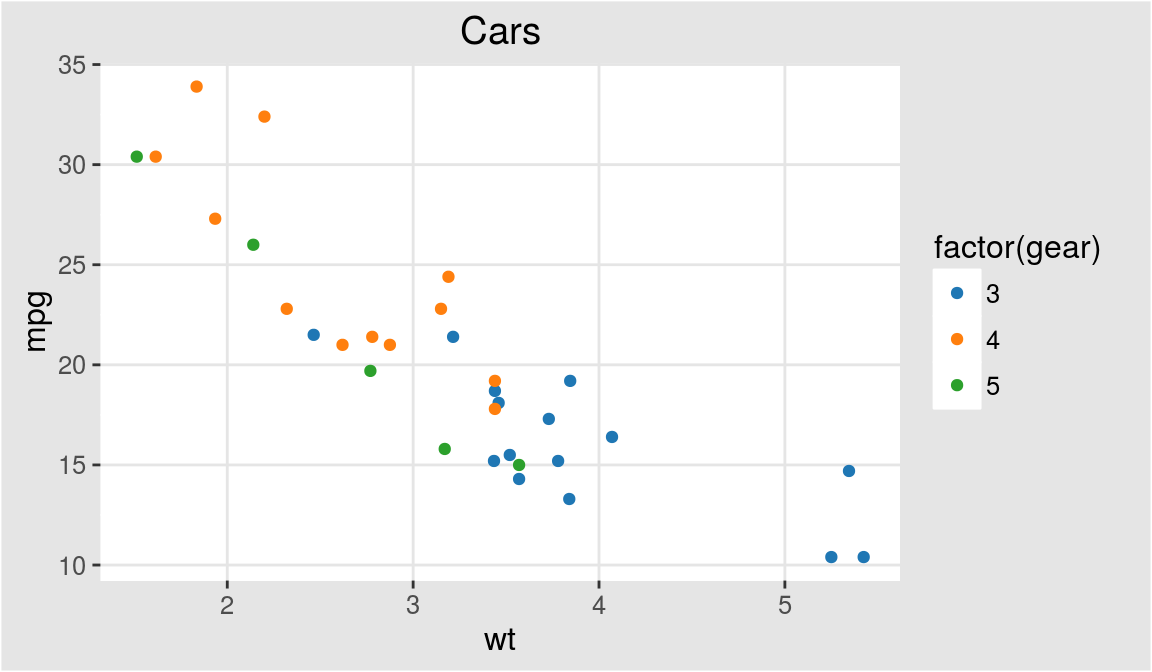
# Tableau Scales
# Color, fill, and shape scales based on those used in the Tableau software.
p2 + theme_igray() + scale_colour_tableau()