ggiraph
Make ggplot interactive
ggstance
Horizontal versions of ggplot2 geoms
ggalt
Extra coordinate systems, geoms & stats
ggforce
Accelarating ggplot2
ggrepel
Repel overlapping text labels
ggraph
Plot graph-like data structures
ggpmisc
Miscellaneous extensions to ggplot2
geomnet
Network visualizations in ggplot2
ggExtra
Marginal density plots or histograms
gganimate
Create easy animations with ggplot2
plotROC
Interactive ROC plots
ggthemes
ggplot themes and scales
ggspectra
Extensions for radiation spectra
ggnetwork
Geoms to plot networks with ggplot2
ggtech
ggplot2 tech themes, scales, and geoms
ggradar
radar charts with ggplot2
ggTimeSeries
Time series visualisations
ggtree
A phylogenetic tree viewer
ggseas
Seasonal adjustment on the fly
ggspectra
https://cran.rstudio.com/web/packages/ggspectra/
ggspectra extends ggplot2 with stats, geoms and annotations suitable for light spectra. It also defines ggplot() and plot() methods specialized for the classes defined in package photobiology for storing different types of spectral data.
# Example from https://cran.rstudio.com/web/packages/ggspectra/vignettes/user-guide.html
library(ggplot2)
library(photobiology)
library(photobiologyWavebands)
library(ggspectra)

# We bind two spectra, to later on demonstrate grouping.
two_suns.spct <- rbindspct(list(sun1 = sun.spct, sun2 = sun.spct * 2))

# We change the default theme.
theme_set(theme_bw())

# ggplot() methods for spectra
ggplot(sun.spct) + geom_line()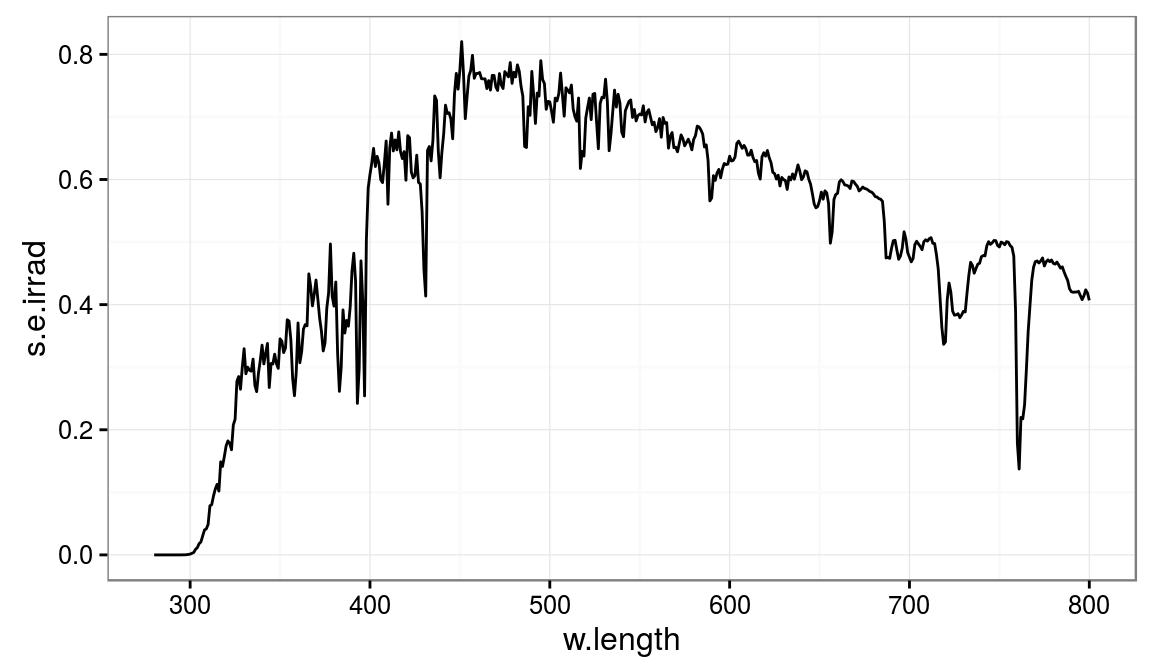
# It is possible to the defaults by means of + and aes() as shown below.
ggplot(two_suns.spct) + aes(color = spct.idx) + geom_line()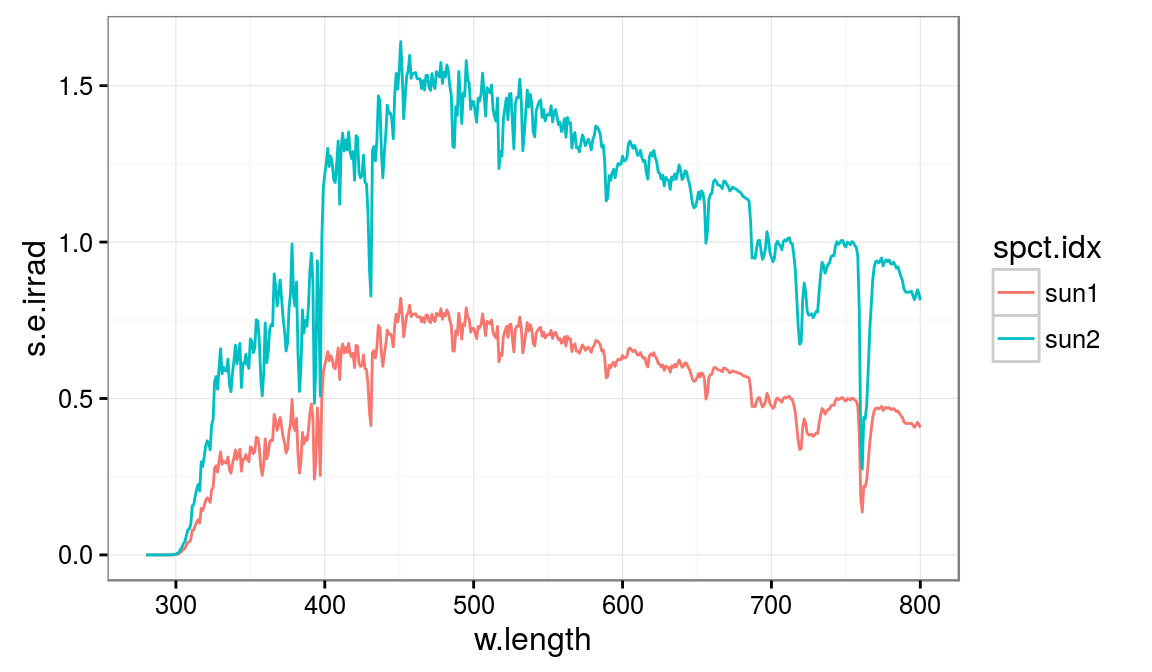
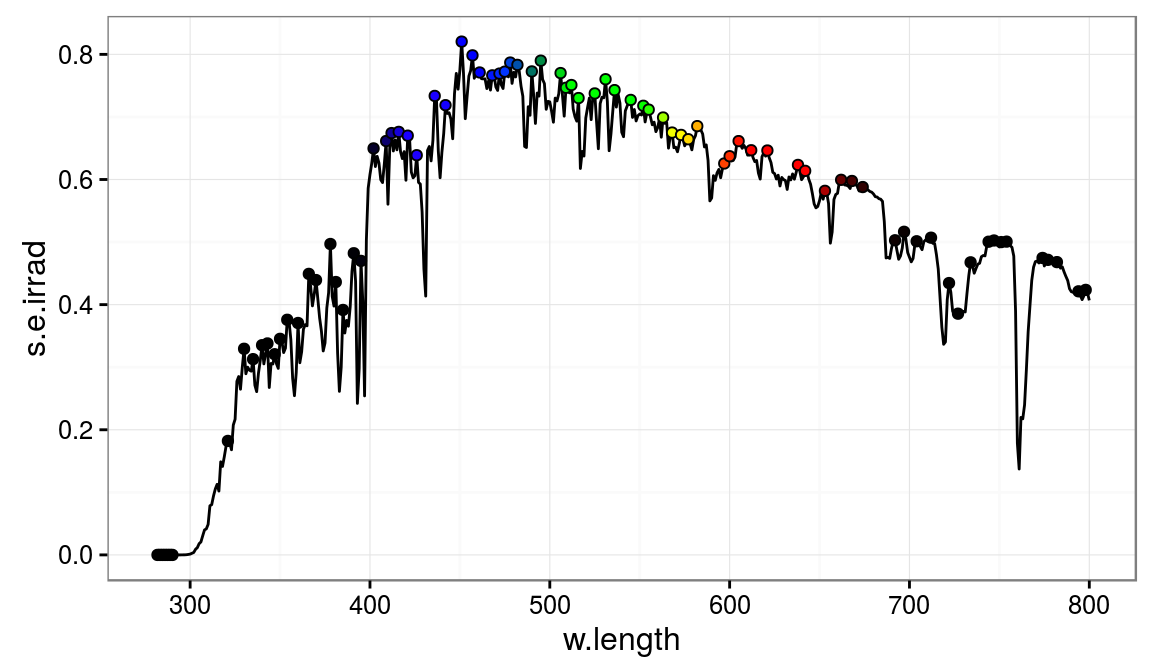
# Several ggplot stats are defined by this package, for example:
ggplot(sun.spct) + geom_line() +
  stat_peaks(shape = 21) + scale_fill_identity()